I have spent far too much time since April developing new features on StormCenter.app. I started off doing so before my own chasecation, then while on the tour. I was supposed to stop afterwards but used the app quite extensively during my own chase, and realized many new things that would be interesting as well as things that needed improvement. So here are a few new things on StormCenter since April:
Proper mobile version

When I started making StormCenter I saw it as a desktop only application. After a while I made some effort to not make it horrible on mobile. After using StormCenter extensively on my mobile during my own chasecation I realized it would actually need a proper mobile version.
This has been implemented now. There are still design bugs and improvements to be made, but it is a LOT better on mobile now.
Get notifications on outlook risks

Notifications has been something I created for myself simply because I wanted to get notified when there was a Moderate risk day coming up – so I could go online and see. I don’t tend to check out weather Twitter all the time, and living in Sweden I don’t really get any heads up. Now I have made this feature publicly available – through the new login section! The neat part is that you can both get emails on any given set of minimum risk, such as Moderate risk or 10% tornado risk – for the entire USA or a given point.
Do you want to get an email if the Day 2 Outlook sets an Enhanced Risk or 5% tornado risk where you live, so you can go out and chase – this is for you!
Get notifications on tornado reports nearby
This is another feature I think is really cool. If you specify a lat/lon-point, you can get a notification if there is a tornado reported within a certain radius of that point. The default range is 10 miles but that can be increased.
See tornado type directly on the map
The problem I wanted to solve with this was that when I look at SPC reports or whatever, there are only a bunch of red dots for tornado reports. You have to look through each one of them to see more. With this new feature you will be able to see:
- The EF-rating of the tornado, directly in the map (by the size of the icon)
- If it is a landspout (specific icon) or a regular tornado
- If the tornado was during sunset or at night. The latter is really useful in understanding whether a given tornado outbreak was actually taking place after dark or not.


Be able to investigate historic dates – with an interactive map

Instead of using the static SPC outlook maps, I now created support for real interactive maps that you can zoom in on and investigate with layers etc for historic dates. Wanna check out May 21st this year, see exactly where the tornadoes were, if they were during the night etc – this is now possible!
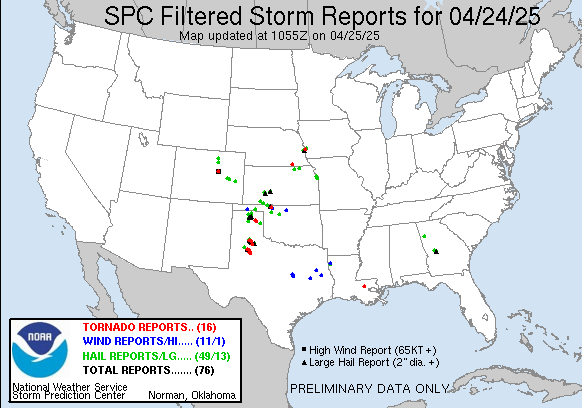
See hail size directly on the map

Using a balanced calculation, the size of the hail icon is now in correlation with the size of the hail in the report. Larger icon = larger hail. This makes it a lot easier to see where there was giant hail in the last 24 hours. I also added relevant icons in tool tips to quickly see if it was “tennis ball”, “golf ball” sized etc.
In this example to the left (still with the old mobile version) you can see examples of up to record sized 6 inch hail in Texas. South of Forth Worth you can see some varying sizes of hail as well.
(Some) Live streaming support
StormCenter does not have any connection with Live storms media or other streaming platforms but any open stream, such as YouTube live, will appear on the map. If e.g. Brandon Copic is live streaming, his icon will be green and you will see a menu option on where to check out the stream!
Login to customize your settings

It is now possible to set the layers as defaults for when you use StormCenter. You can choose to not see wind reports, your favorite map style etc, and turn off radar (which I tend to do) as a default setting.
Find your position
I realized while using it on mobile that it is quite useful to zoom in your own position. Now there is support for this.
Search for a town

You can now search for a given small town in the map. Perhaps someone wrote on Twitter about some exciting weather unfolding there, but you have no idea where it is – now you can search and zoom in on it.
Current events

There is now a top bar icon that shows any current event that happens. E.g. a new tornado report, a funnel cloud or rotating wall cloud appearing somewhere. It also shows large hail.
AI supported forecast

I sometimes struggle with understanding the SPC outlook so I created an AI supported briefing and extraction of information from the SPC outlook. This can now be seen under “Forecast”. It translates for example the outlook into what is interesting from a chase perspective, such as “do they mention possibilities for supercells and tornadoes” and “what are promising and inhibiting factors in today’s outlook”?
Who was nearby a certain tornado report?

If you click on a tornado report, you can now see who was there when it happened. It may not be that the particular chaser actually saw the tornado (I know from experience from this season that this is often not the case) but you can check out these chaser’s Twitter accounts for more info, and possible photos/videos.
Distance each chaser travelled in the last 24h

It is cool to see how far certain chasers drive during a chase day. There is a now a feature to see the number of miles a certain chaser has driven during the last 24h. During May, Peter Wharton (whose tour I chased with) and before mentioned Brandon Copic was constantly in the top-5!
—
Outside of this, there are some minor adjustments here and there. Whenever I feel I want to develop some more, the next major feature I will create is an “Historic Insights” map tool. Something to analyze any given area, at any given period in time and get answers to questions like: how many tornadoes have there been around Manhattan, KS, over the last 20 years? What if you put all the tornado warnings of the last 10 years over a map, how would that look? Which area does in fact get most landspouts etc. I hope this will prove to be useful.
Please follow me on Twitter @stormchasingusa to get more updates on features. Please also provide feedback on what you would like to see in the app – and if there is something that is confusing, bad UI or not working at all!
Lastly, a special thanks to F5Weather, who also have great storm maps.